PairGAN Battery Test
Click the "Load Test Data" button first to load a test image. The left image is the raw data with original size and quality. The right image is generated by taking the radon-iradon transform with 60 projections to mimic the low-quality input.
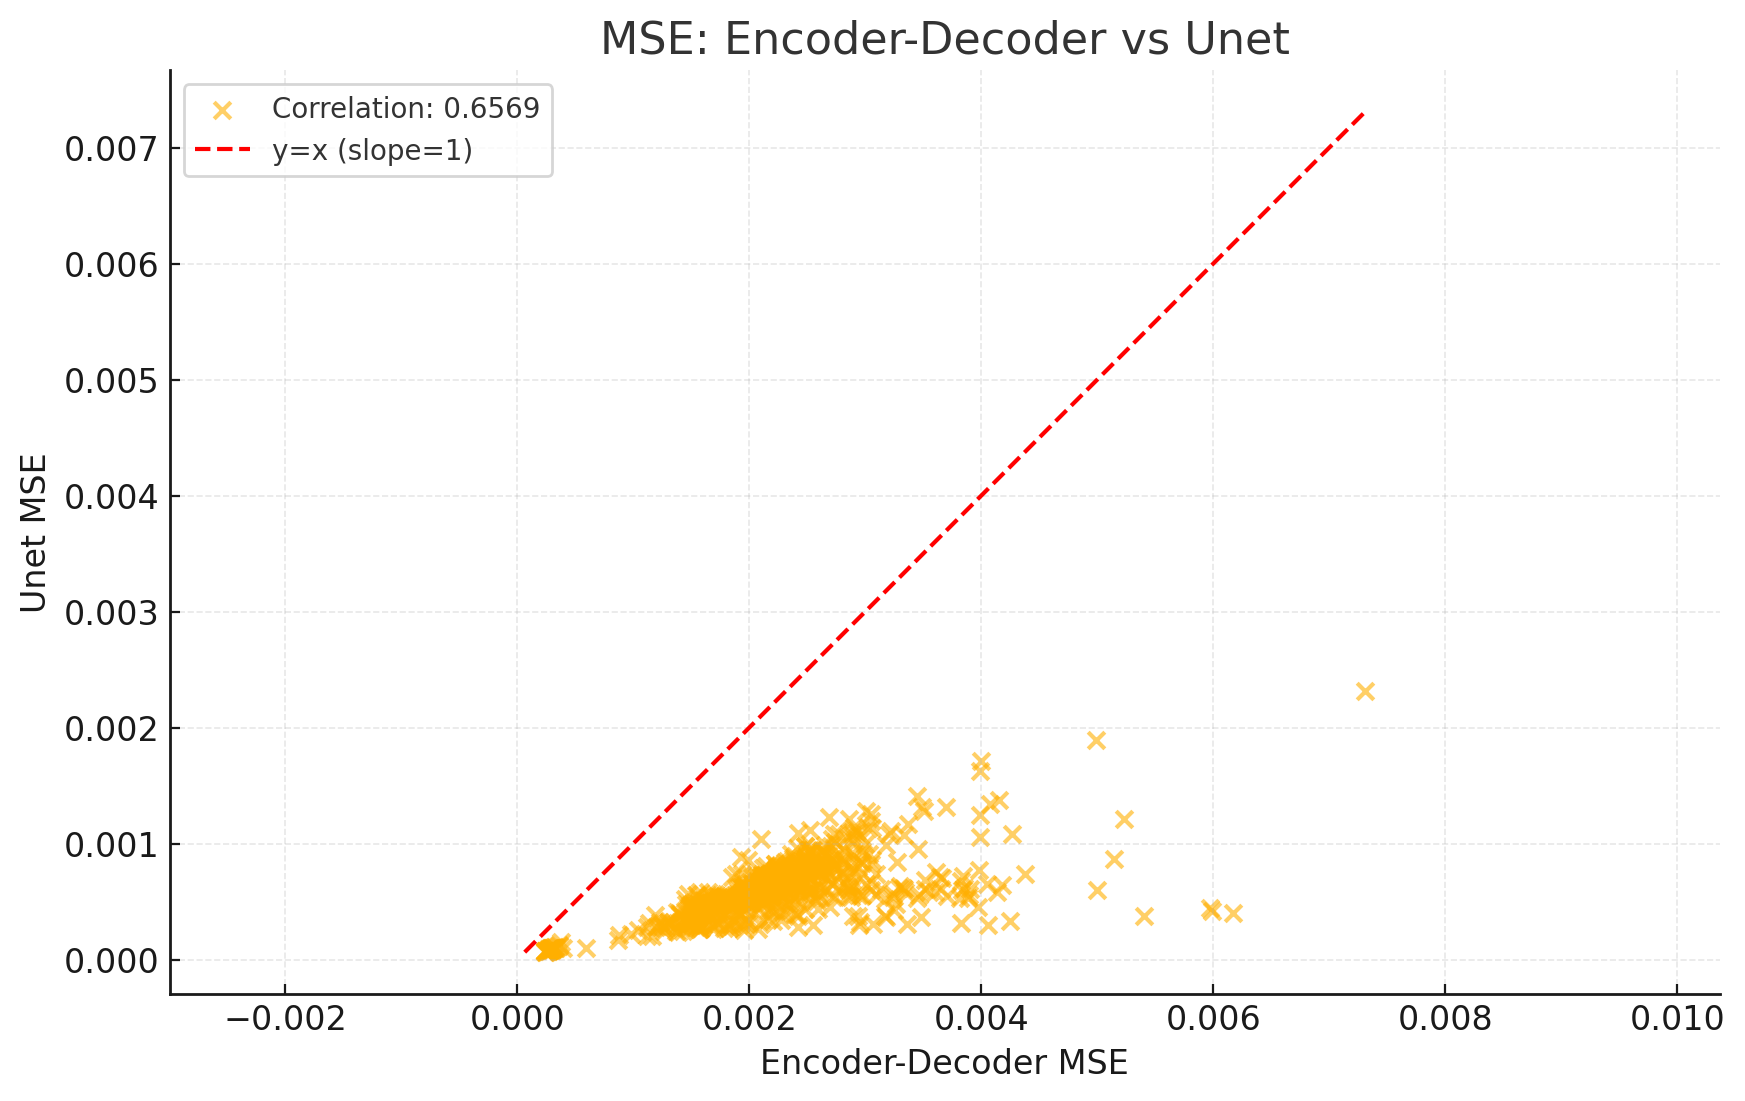
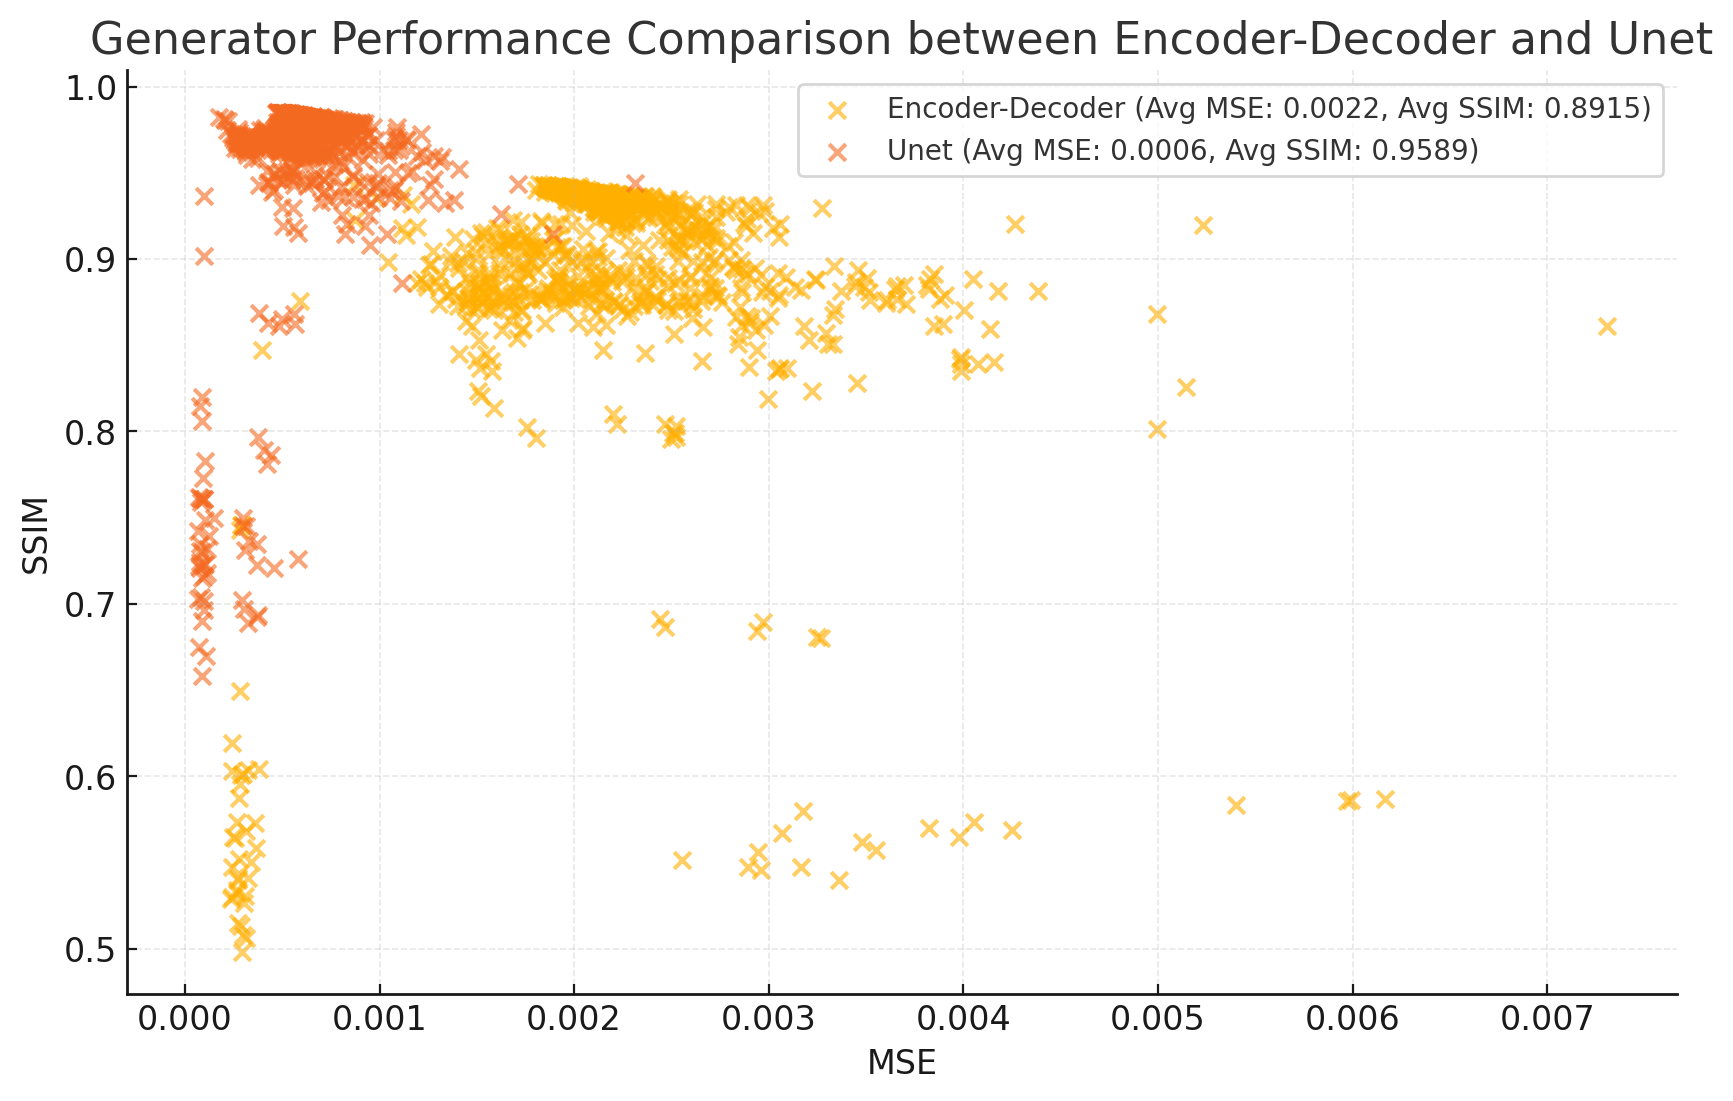
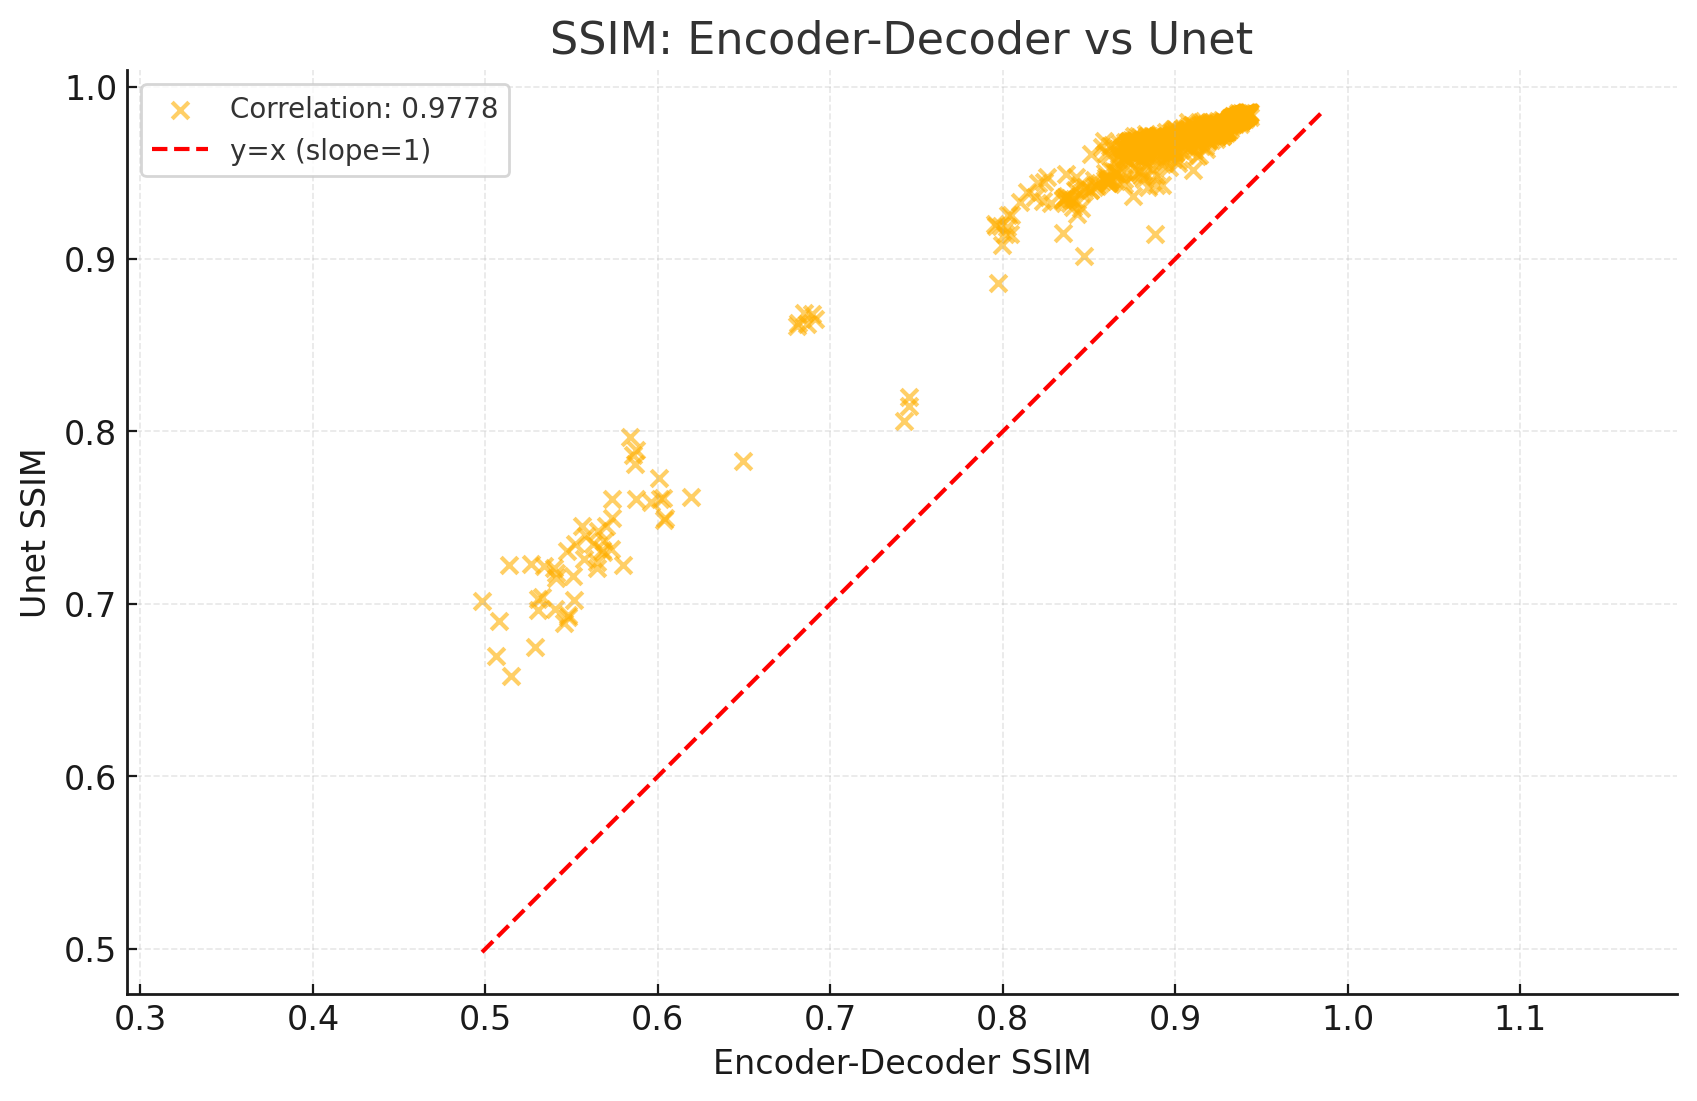
Click the "Run PairGan" button to check the PairGAN results. The method takes the low-quality image above as the input and passes it to two PairGAN networks: 1: Encoder-Decoder (Left), 2: Unet (Right). The generated images' quality is evaluated using Mean Squared Error (MSE) and Structural Similarity Index Measure (SSIM), comparing them to the top-left image. These metrics assess how closely the synthesized images resemble real CT scans in terms of pixel-wise accuracy and perceptual similarity.
Performance Comparison between Encoder-Decoder and Unet Generators with 1000 Test Cases